LGTM Stack Explained
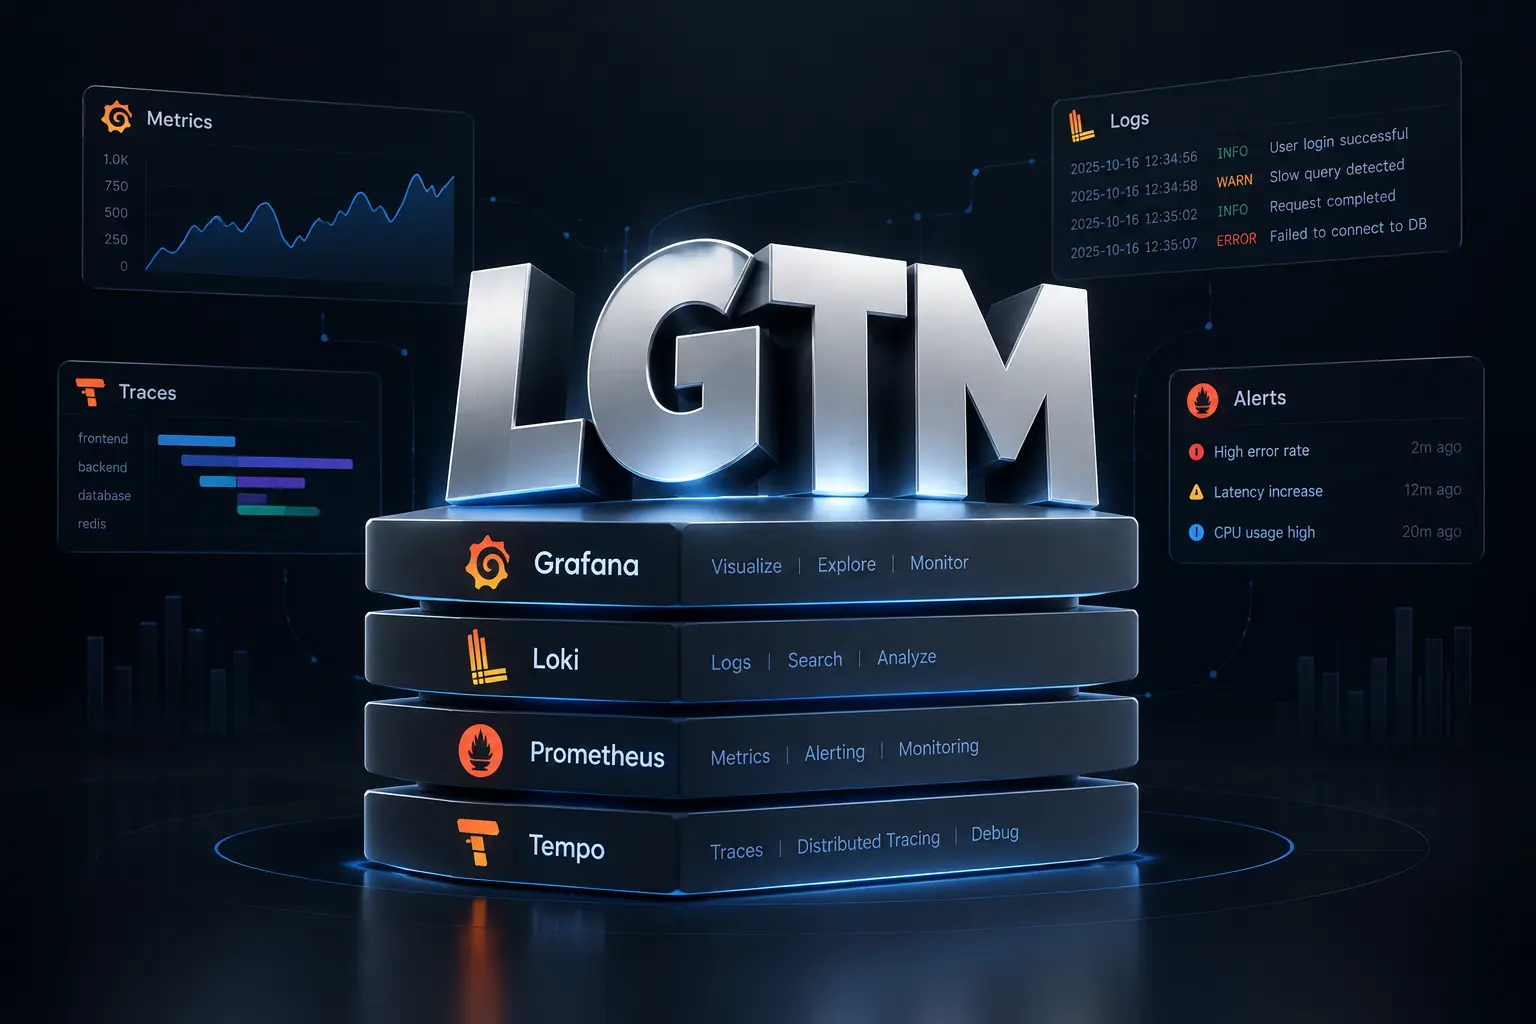

The LGTM stack is a popular open-source observability stack maintained by Grafana Labs. It is designed to collect, store, and visualize logs, metrics, and traces in a unified way.

LGTM stands for:
Loki – Logs
Grafana – Visualization and dashboards
Tempo – Distributed tracing
Mimir – Long-term metrics storage
Together, these tools provide a complete observability solution that many teams use as an alternative to heavier or more expensive platforms.
Loki
Loki is a log aggregation system inspired by Prometheus.
Unlike traditional logging systems, Loki indexes only metadata (labels) instead of the full log content. This makes it much more cost-efficient and easier to operate.
Key characteristics:
Label-based indexing
Horizontal scalability
Low resource usage compared to Elasticsearch
Native integration with Grafana
Loki is commonly used to store application logs, system logs, and container logs.
Grafana
Grafana is the visualization and exploration layer of the stack.
It connects to Loki, Tempo, Mimir, and many other data sources to create dashboards, alerts, and exploratory views.
With Grafana you can:
Build dashboards for logs, metrics, and traces
Correlate logs with traces and metrics
Set up alerting rules
Create unified observability views
Grafana acts as the single pane of glass for the entire LGTM stack.
Tempo
Tempo is a distributed tracing backend.
It stores traces at high scale with minimal indexing, making it efficient and cost-effective.
Tempo works well with:
OpenTelemetry
Jaeger
Zipkin
It allows developers to follow requests across microservices and understand latency and failures.
Mimir
Mimir is a highly scalable, long-term storage system for Prometheus metrics.
It is designed for large multi-tenant environments and can handle high cardinality metrics reliably.
Mimir is often used when teams outgrow a single Prometheus instance and need durable, scalable metrics storage.
Why Teams Choose the LGTM Stack
Fully open source
Cost-efficient compared to traditional ELK or commercial APM tools
Strong integration between logs, metrics, and traces
Scales from small projects to large production systems
Active development and large community
Typical Architecture
Applications and infrastructure send:
Logs → Loki
Traces → Tempo
Metrics → Mimir (or Prometheus)
Grafana sits on top and provides a unified interface to query and visualize all three signals.
Conclusion
The LGTM stack offers a modern, efficient, and unified approach to observability. By combining Loki for logs, Tempo for traces, Mimir for metrics, and Grafana for visualization, teams can build a powerful monitoring system without relying on heavy or expensive proprietary platforms.